The ‘Gantt chart’ is the tool favoured by PhD supervisors and funders for plotting a research timeline. Natalie Davies writes about the benefits of Gantt charts, and how you can make your own Gantt chart in four easy steps.
First, let’s define what a Gantt chart is…
A Gantt Chart is a type of bar chart that enables you to plot all the tasks your project involves, how time-consuming they are, and when you would need to start them.
You can make your own Gantt chart from scratch, or adapt a free template in software such as Excel or Canva. And the finished product can be as plain or as aesthetically pleasing as you like, as straightforward or as complex as you see fit.
All you need for it to look and function like a Gantt chart is these key ingredients:
- Timescale: the period during which you will complete your project (e.g. ‘I need to write my thesis between September and May this year’).
- Task names: a list of every activity that makes up your project (e.g. ‘I need to draft my introduction, draft my literature review, compile a list of every source in a reference list etc.’).
- Activity bars: how long each activity will take, and when they will take place (e.g. ‘my literature review will take two months, and I will need to start it in November’).
The pros and cons of using a Gantt chart
Gantt charts have several benefits:
- They make it easy to see what is expected of you.
- They are flexible: you can shift tasks forwards or backwards along the timeline if something changes.
- They show how your ability to start one task might depend on you finishing another.
Of course, Gantt charts have their downsides too:
- They can take a long time to set up, particularly if it’s your first time.
- They are effective at showing the estimated time it will take to complete a task, but not how intensive the work will be during this time.
- They rely on you knowing how long it will take to complete a task in theory versus in practice – in other words, the minimum amount of time you should allocate to get something done, and then the time you should allow on top of that to give you a bit of a buffer.
How to create a Gantt chart
Whether you have a personal drive to manage your projects using this tool, or a manager/supervisor/funder has required it of you, everyone can follow the same basic steps to create a Gantt chart…
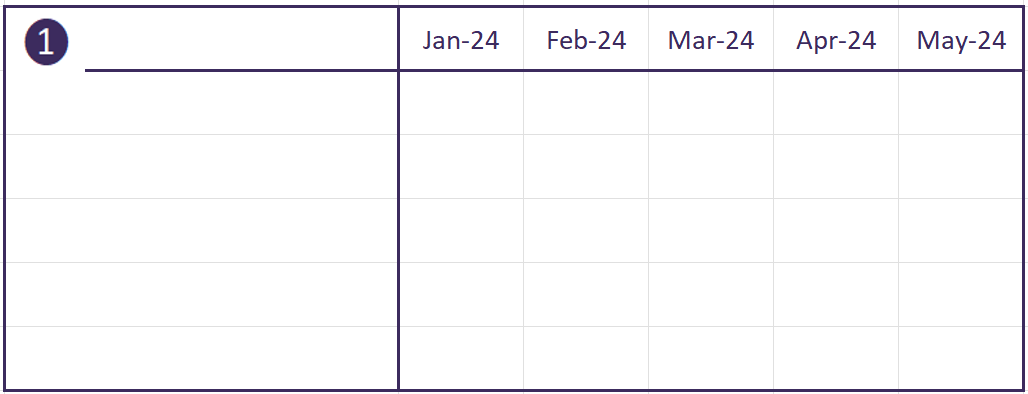
1) Draw your timeline: Imagine your project will take three years and six months. Draw this as a timeline across the page, with your start date and end date at each end, and the 42 monthly increments marked along the way.
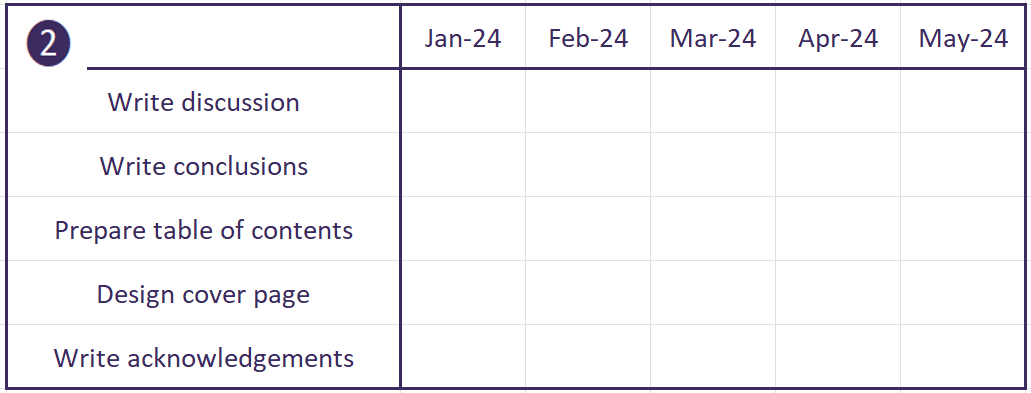
2) Identify your tasks: Next, make the timeline 2D. Write a list of your tasks down the left-hand side of the page. You should have something resembling an upside-down chart (time along the X-axis and tasks along the Y-axis).
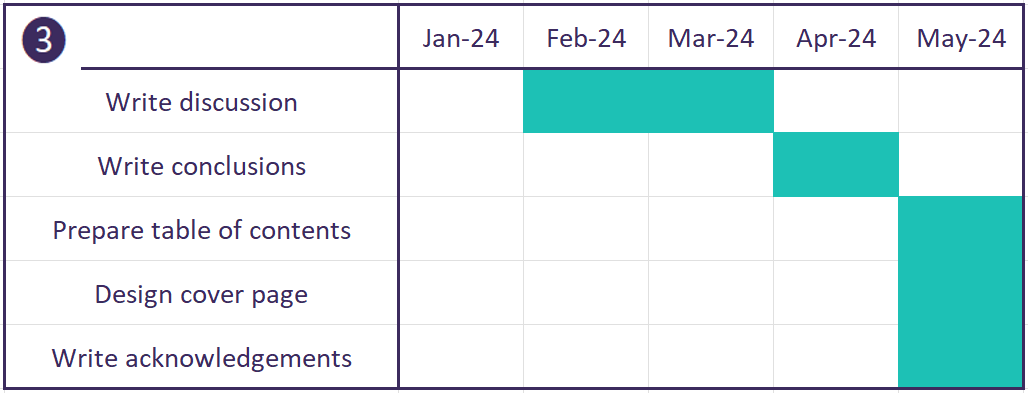
3) Schedule those tasks: Shade in when you plan to complete each task, paying attention to which tasks can overlap or be undertaken at the same time, and which tasks depend on you completing other tasks first.
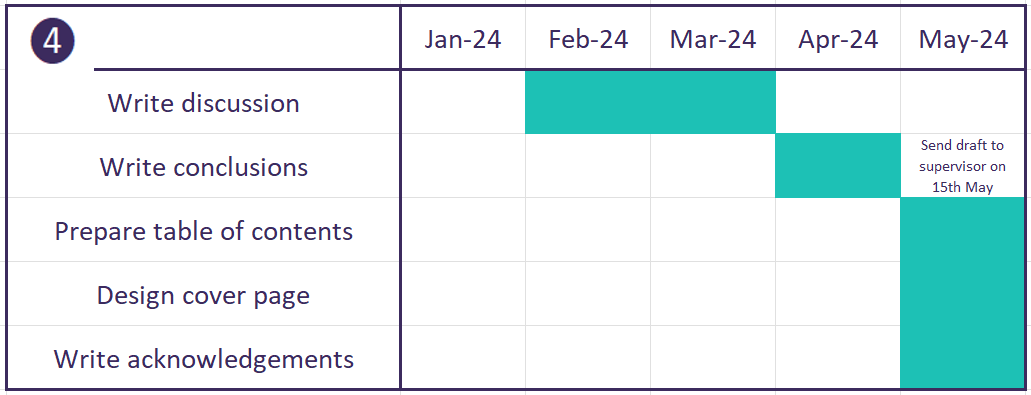
4) Highlight any external deadlines or events: Lastly, add any dates you know about in advance, or periods of time that you anticipate could add pressure to you and your workload.
Final tip: ‘Be a scientist about it’
Before you start drawing your X- and Y-axis, read Rob Calder’s blog titled “Tips to avoid your Gantt chart becoming a work of fiction”. Rob is the SSA’s Head of Communications and completed his PhD in 2018. He has had plenty of experience designing Gantt charts, and plenty of experience seeing them fall apart. Don’t let this put you off Gantt charts, though. As Rob says, “It is infinitely better to have a detailed plan that adapts to change than to have no plan at all”.
One of Rob’s recommendations is to canvas opinions on how long certain activities will take. For example, if you’ve never piloted a survey before, ask someone who has. That way, your timeline can be informed by experience (as well as a bit of guesswork).
“At some point, you’ll be working on your Gantt chart (idly wondering whether to colour-code processes differently from tasks) and will need to decide on how long to allocate for ‘pilot first survey’. Don’t make it up. Ask someone who has piloted a survey. Ask several people and average their responses. Be a scientist about it and base your time estimates on data and not imagination. Don’t risk having your wonderful project reviewed by someone who looks at your Gantt chart and thinks, ‘Two weeks for piloting a survey? Not a chance!’, and circles a withering ‘2/10’ in the margins of your application in a devastating red pen.”
The opinions expressed in this post reflect the views of the author(s) and do not necessarily represent the opinions or official positions of the SSA.
The SSA does not endorse or guarantee the accuracy of the information in external sources or links and accepts no responsibility or liability for any consequences arising from the use of such information.